PlcConsole
Remote Manual · Signals

Operations and dashboard

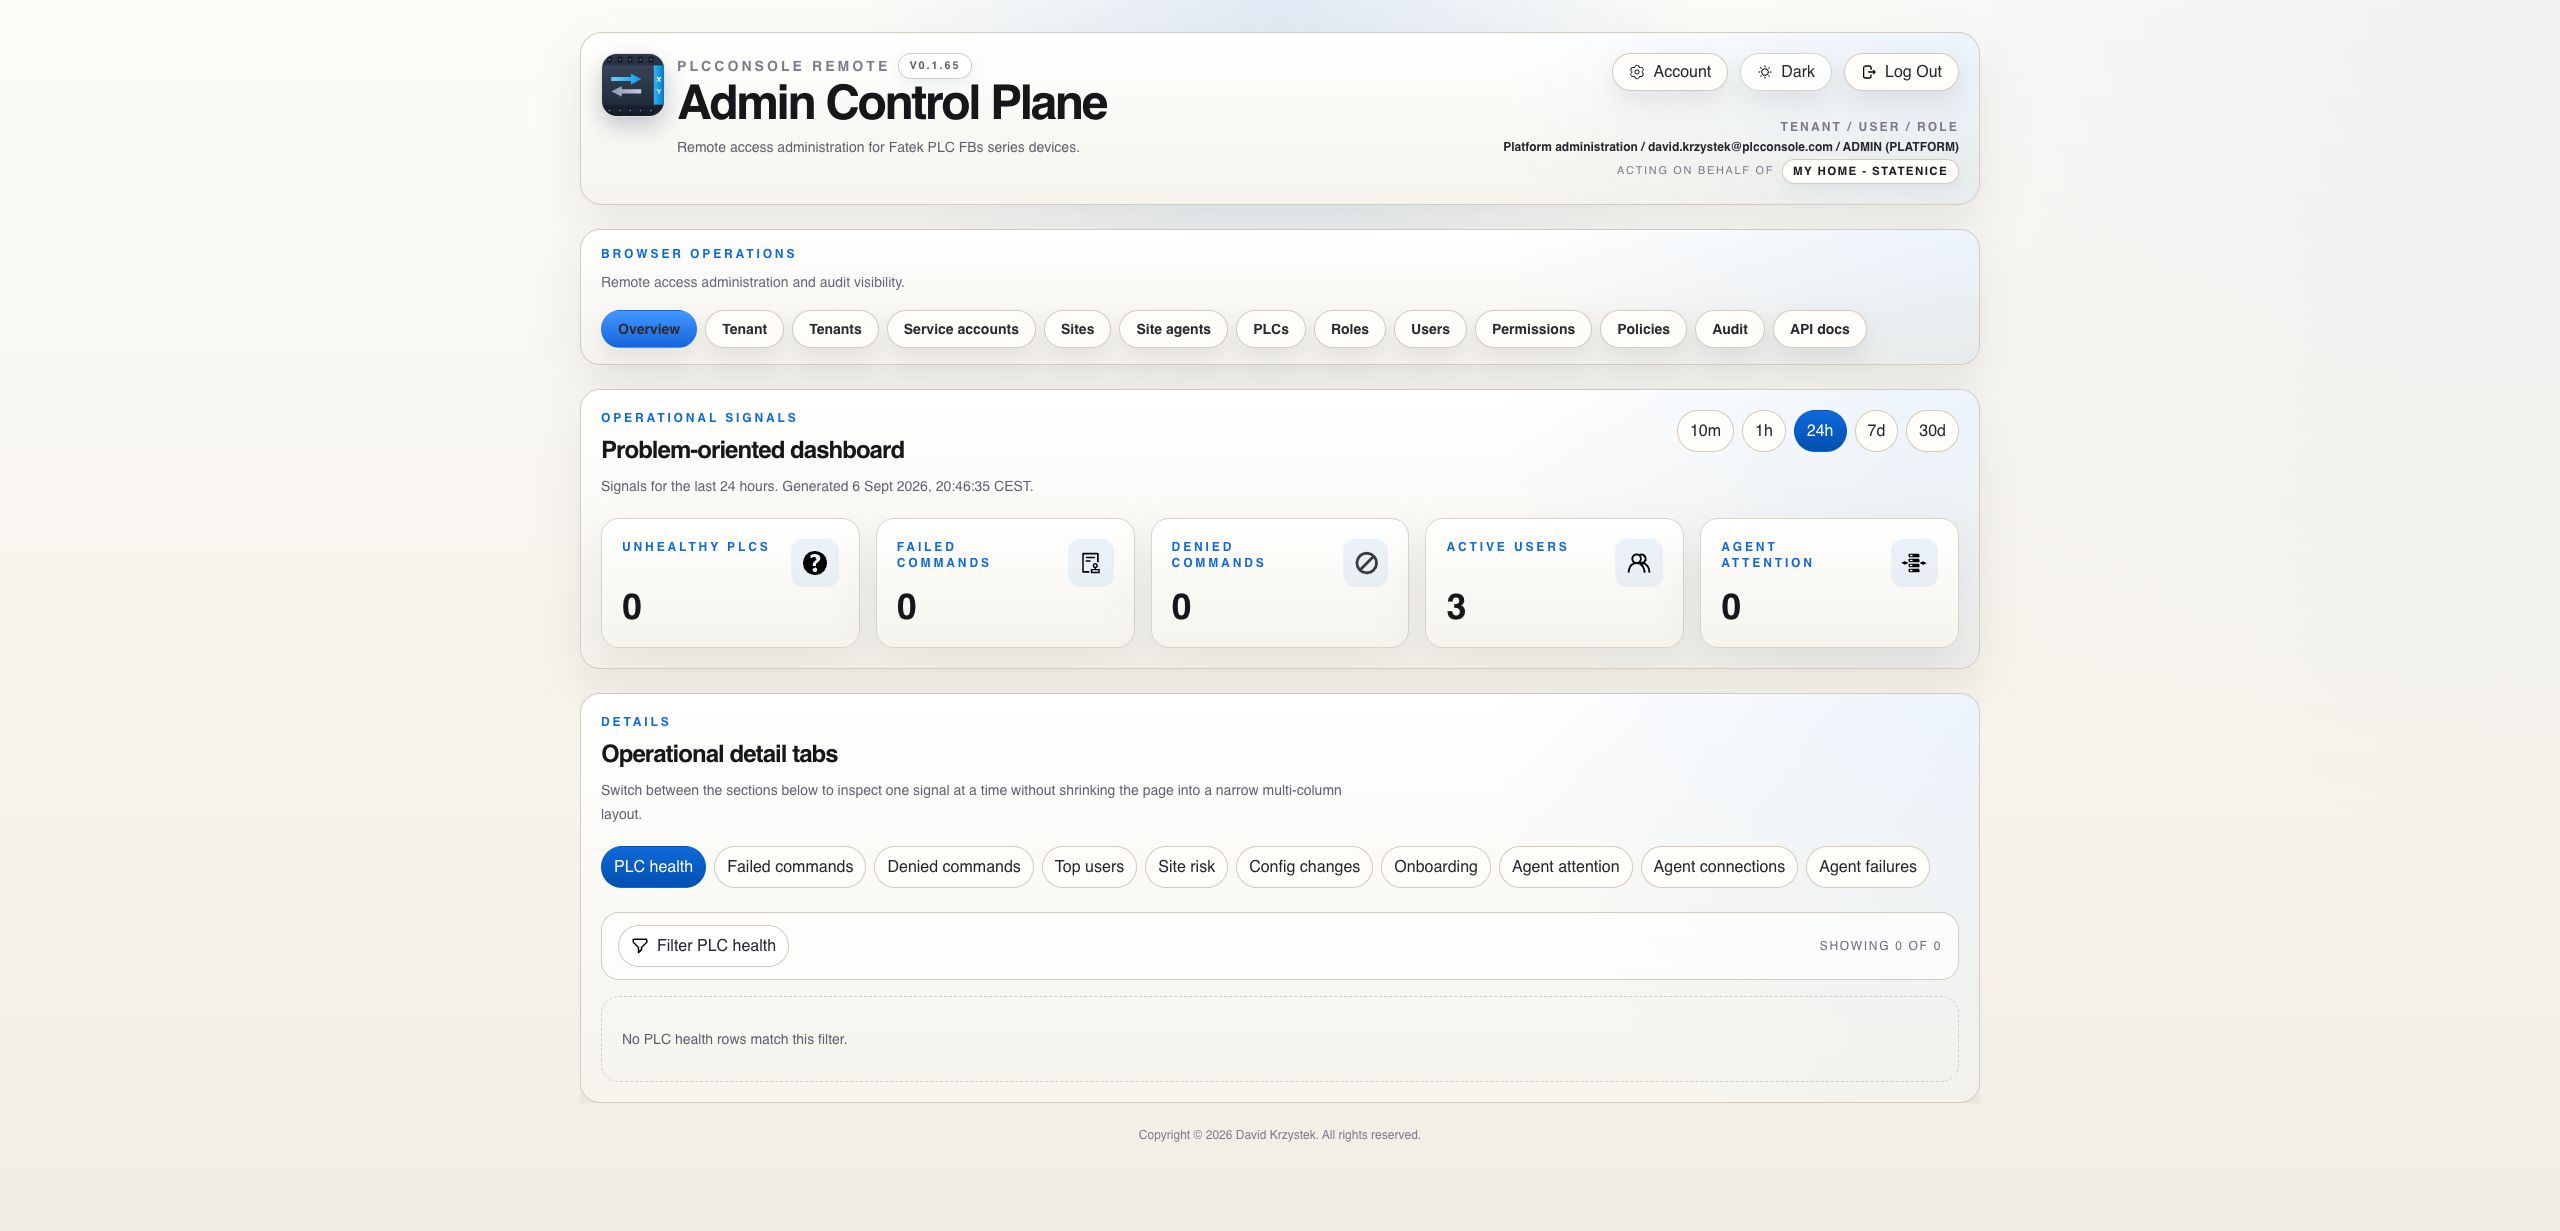
Choose the time window that matches the question, identify the signal and inspect its detailed evidence.

Problem-oriented Dashboard

Start with what requires attention

Administrator summary cards are directional signals. Detailed records remain in the selected operational tab.

Time Windows

Match the window to the investigation

10mActive incident
1hRecent issue
24hOperating day
7dRecurring problem
30dLonger pattern

Changing the window recalculates both the summary and the detail query. Use a short window to understand what is happening now and a longer window to identify recurrence rather than comparing counts from different periods as though they represented the same workload.

Operational Detail

Inspect one signal at a time

  • PLC health: device health and latest observation.
  • Failed commands: execution failures after an operation was allowed.
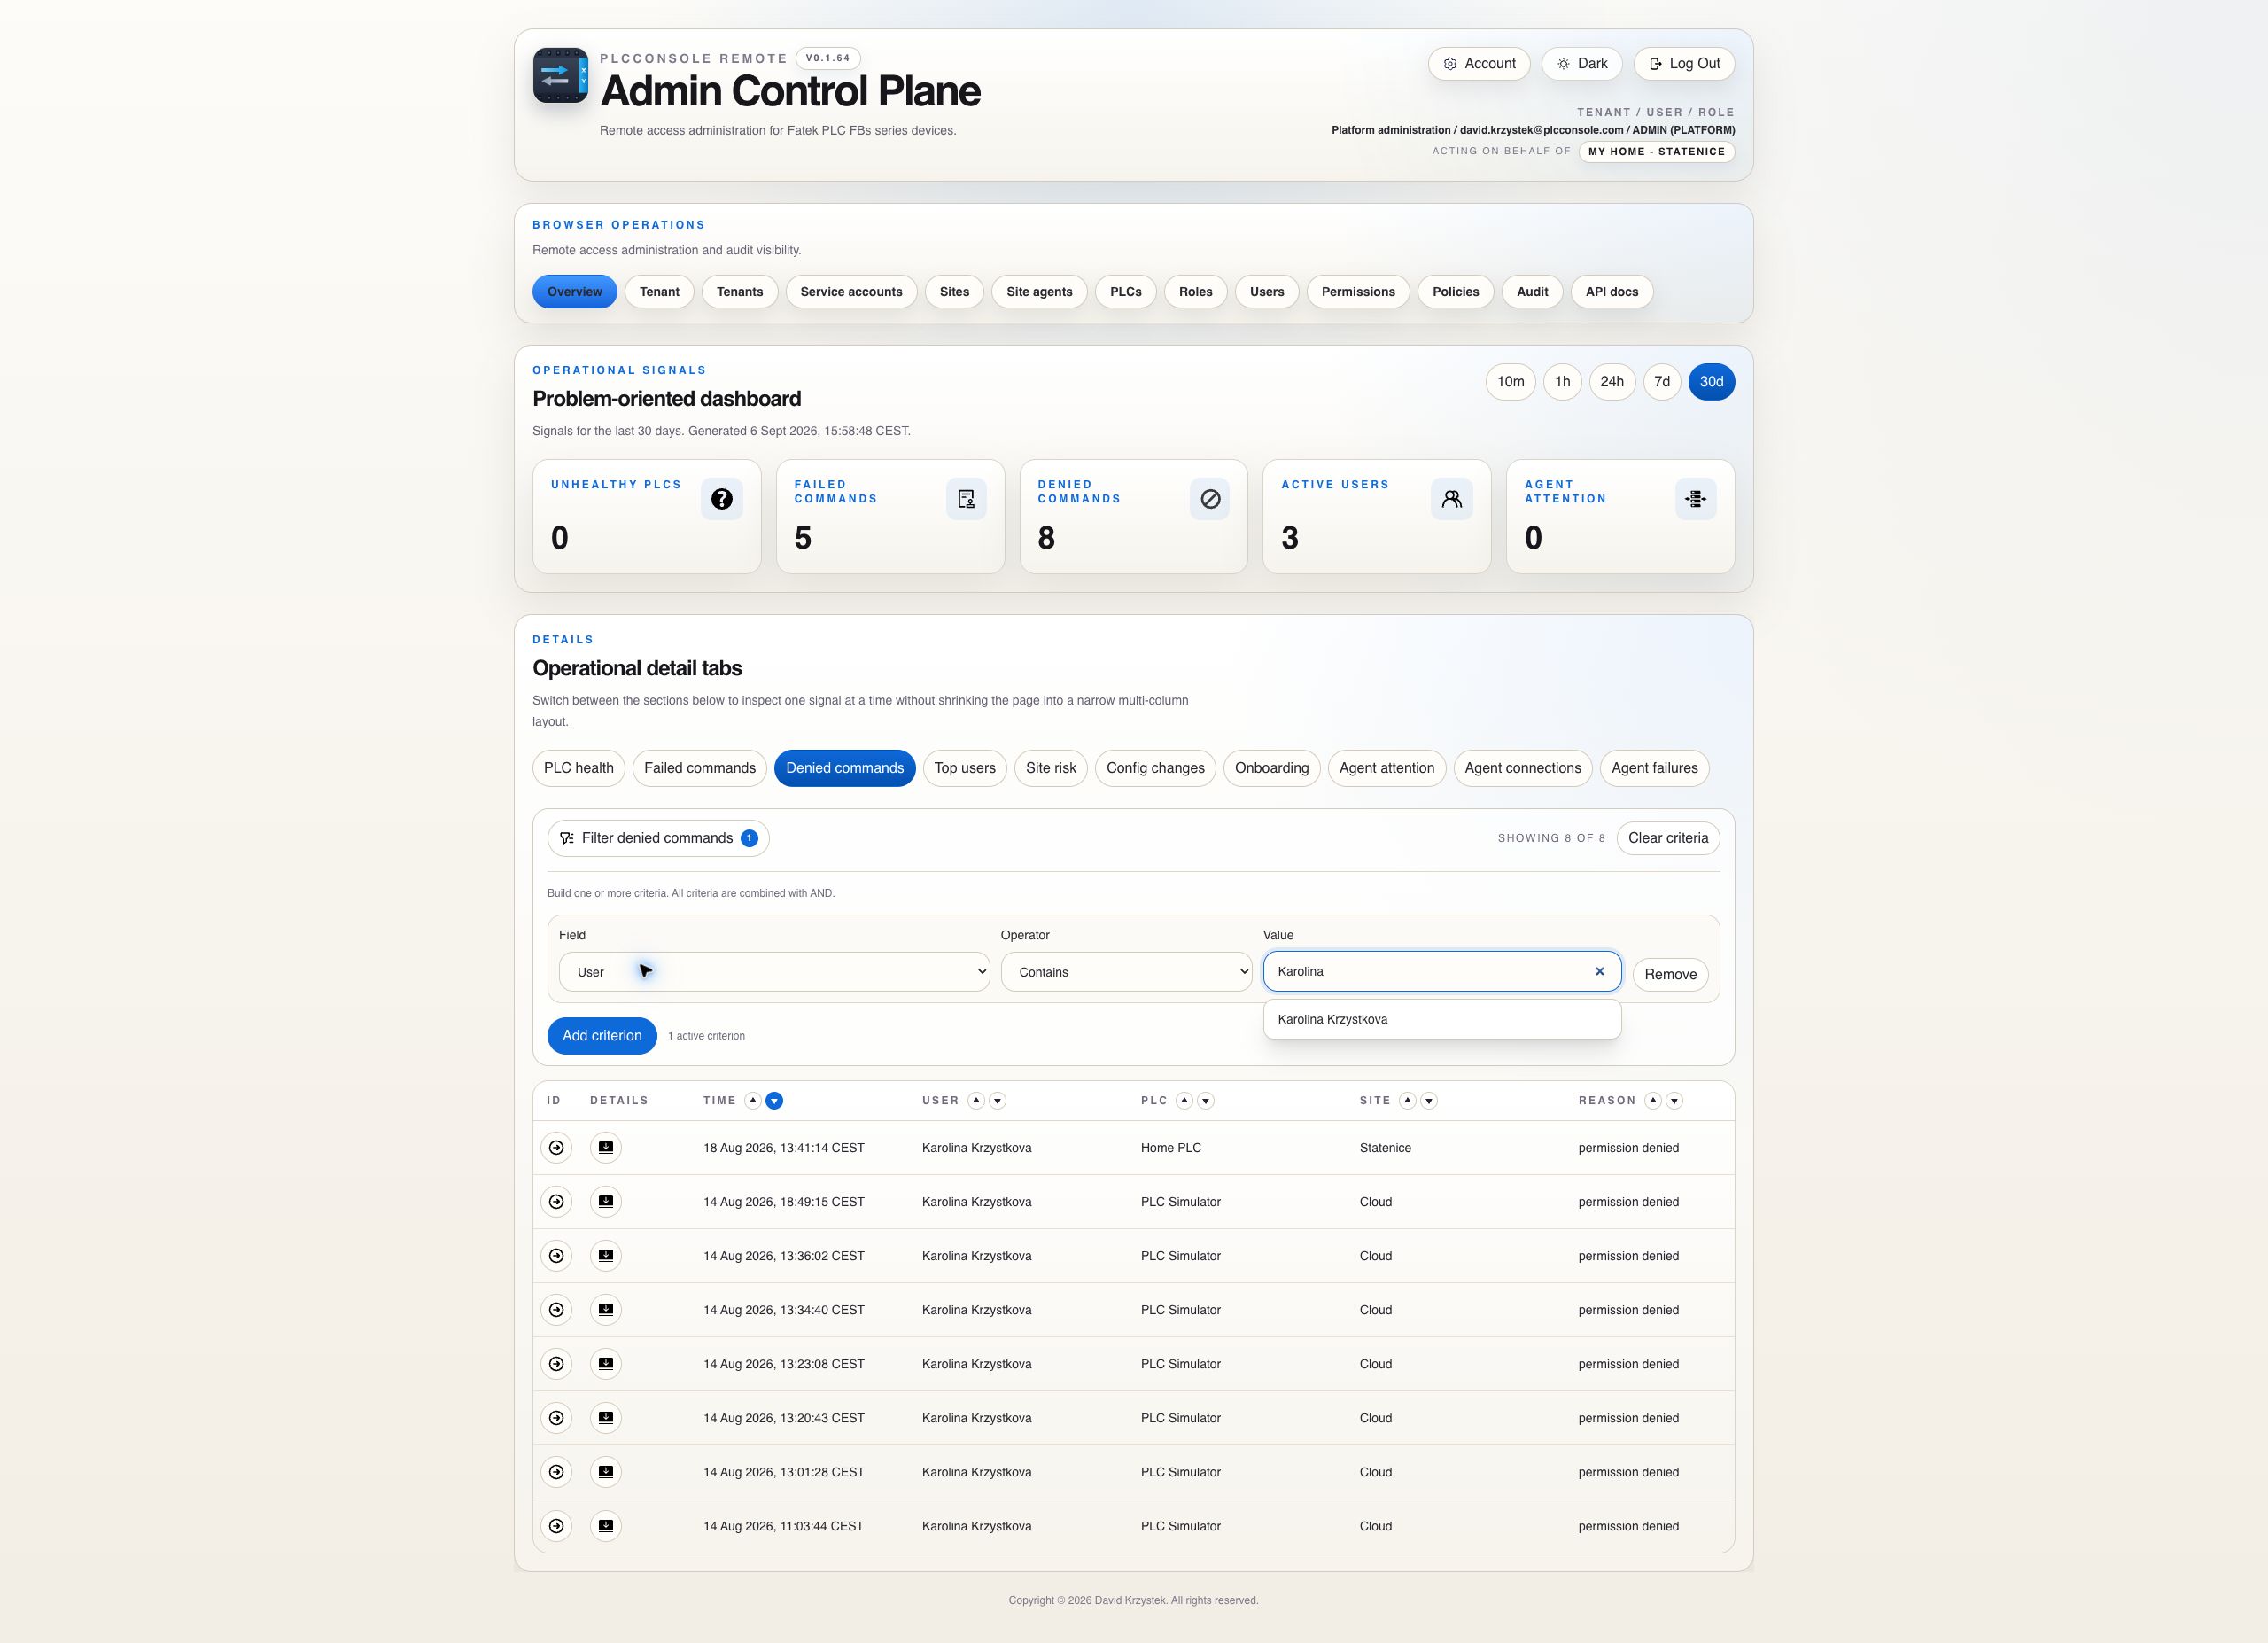
  • Denied commands: authorization or policy denials. Request detail and correlation remain in expansion.
  • Top users: user activity within the selected period.
  • Site risk: site-level conditions that may require intervention.
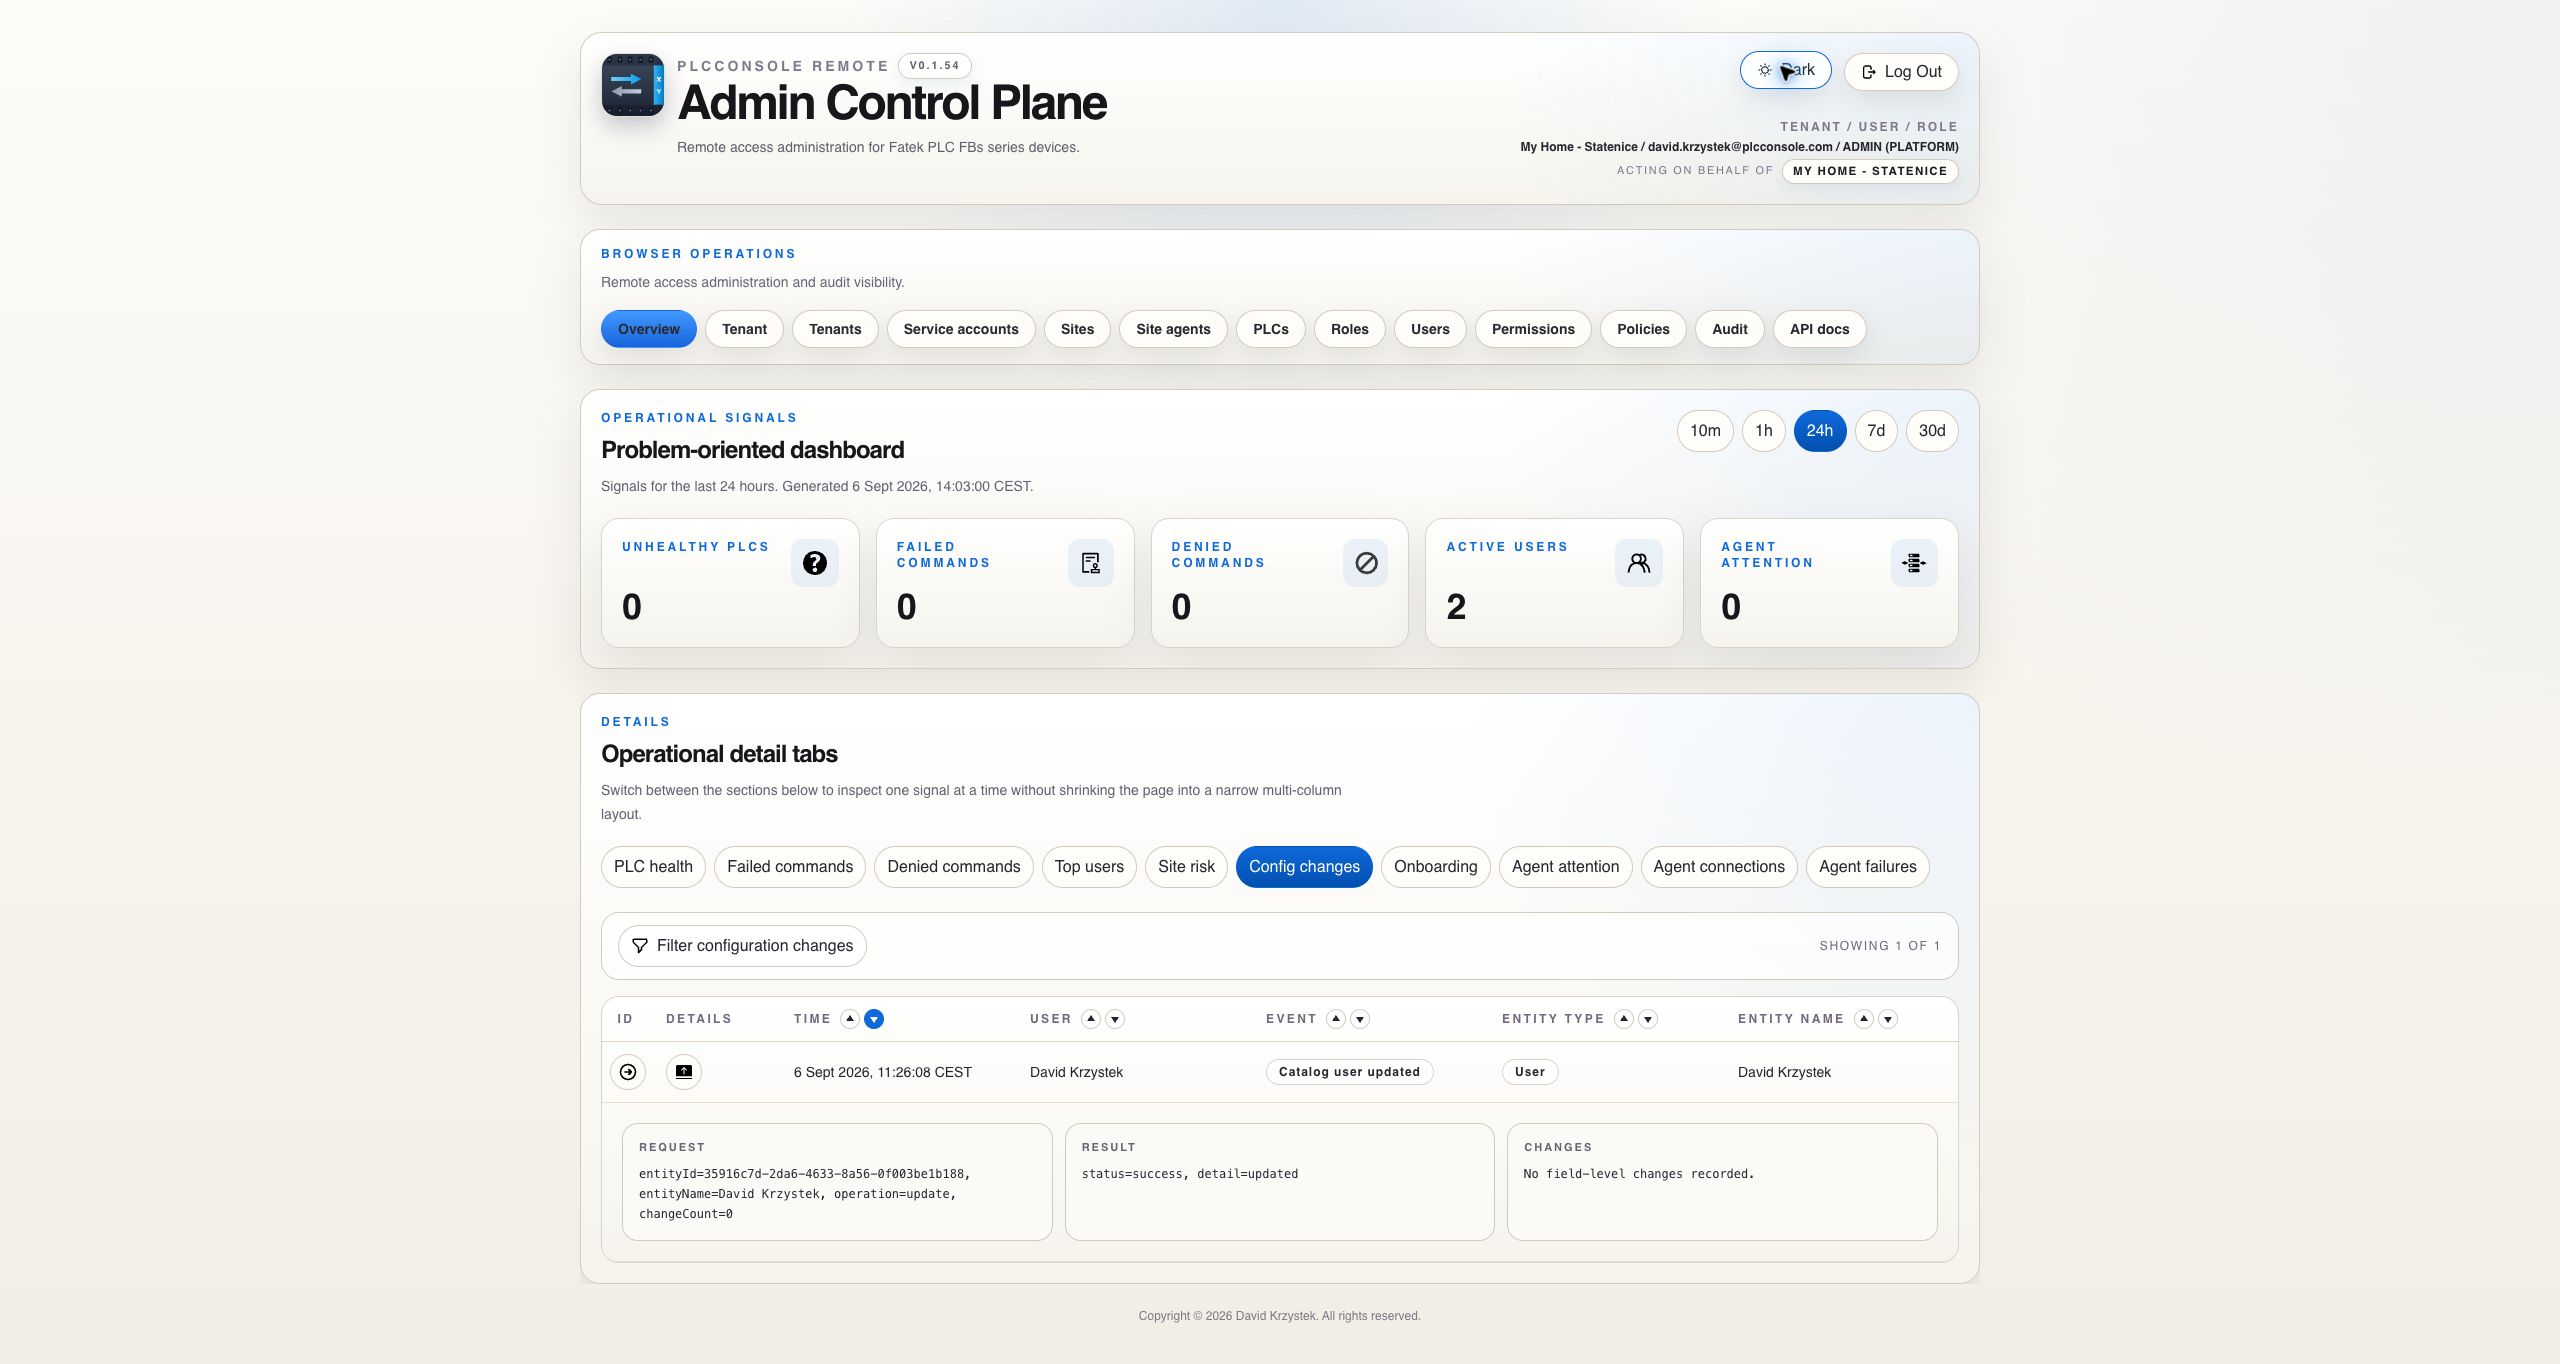
  • Configuration changes: administrative changes with request, result and changed-field expansion.
  • Onboarding: incomplete setup or resources that have not reached an operational state.
  • Agent attention: agents needing immediate review.
  • Agent connections: connect, disconnect and version-change history with duration and address where available.
  • Agent failures: failure summaries with long failure and correlation values moved to expansion.
My PLC Access

Controllers, operators and viewers receive a personal view

Non-admin users do not receive the estate-wide administrator dashboard. Their overview is limited to PLCs visible to the signed-in user, effective capabilities and the previous 24 hours of attention or activity.

Role permissions are the baseline shown to the user. A PLC command policy may still narrow register families and ranges and the backend evaluates both boundaries for every command.

Signal Reference

Interpret each count before opening the detail

Dashboard cards summarize records in the selected time window. A count is a starting point, not a diagnosis.

SignalQuestion it answersFirst detail to inspect
Unhealthy PLCsWhich visible devices currently have health evidence requiring attention?PLC health, latest probe, site route and agent state.
Failed commandsWhich allowed operations reached execution but did not complete successfully?Failure class, PLC, site, duration and correlation evidence.
Denied commandsWhich requested operations were stopped by visibility, permission or policy?User, PLC, site, denial reason and request attributes.
Active usersWho generated activity during the selected period?User identity and associated event volume.
Agent attentionWhich site-agent conditions require connectivity or heartbeat review?Agent state, last connection, heartbeat and last error.
Time windows: use 10m or 1h for a live incident, 24h for the current operating day and 7d or 30d for recurrence and trend context. Changing the window changes the summary and the records behind it.
Operational Workflow

Move from signal to evidence without losing context

Steps

  1. Confirm the active tenant and select the shortest time window containing the symptom.
  2. Choose the summary card or operational tab that matches the observed condition.
  3. Filter by PLC, site, user, agent, event or result to reduce the working set.
  4. Sort by time descending when investigating a recent incident.
  5. Expand the relevant row and retain its correlation identifier.
  6. Open Audit when you need the authoritative request and result attributes.
  7. Compare application, site-agent or infrastructure logs only after aligning tenant, timestamp and correlation.

Denied is a control decision

Check visibility, effective permission scope and the PLC's command policy. The request should be stopped before PLC traffic when authorization or policy does not allow it.

Failure is an execution outcome

Check route availability, PLC reachability, timeout, queue and protocol result. The user may have been authorized even though execution failed.

Configuration changes explain drift

Expand the change record to see request, result and changed values. Use it to determine whether an operational symptom followed an administrative edit.

Onboarding explains incompleteness

Use onboarding issues to find resources that exist but are not yet usable, such as a site without its expected connectivity or a tenant awaiting setup completion.

Troubleshooting

Check scope and filters before concluding there is no evidence

Count and table differ

Confirm that the same time window and detail tab are active, then clear filters. Pagination can place matching records on another page.

PLC absent

Verify the active tenant, user visibility and PLC lifecycle state. A command policy does not make a hidden PLC visible.

Agent repeatedly reconnects

Open Agent connections and Agent failures together. Match the timestamps and inspect the current site-agent detail before changing credentials.

Long value overlaps

Use the table's horizontal scroll area or expand the row. Command, failure and correlation detail belongs in secondary detail rather than being inferred from clipped text.