 PlcConsole
Dashboard
Description
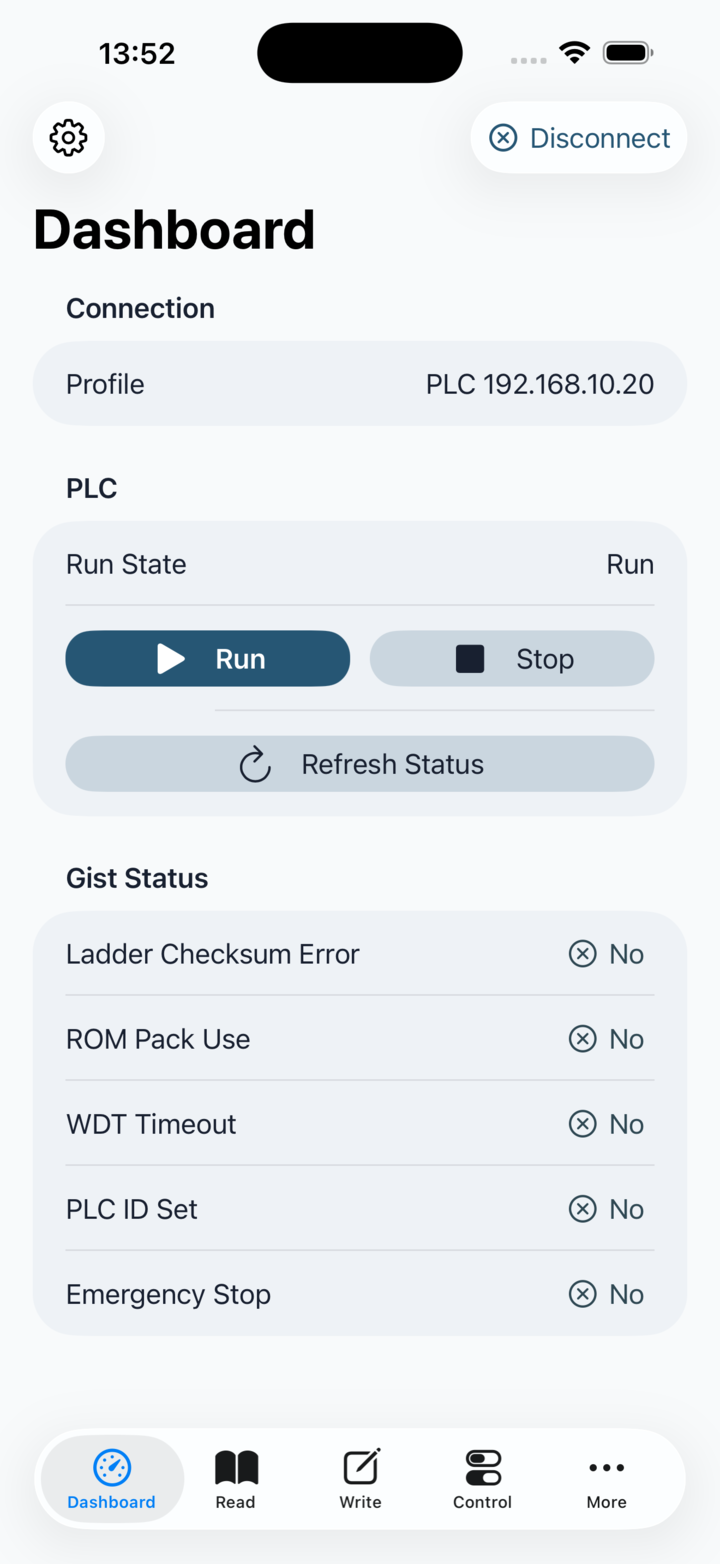
The Dashboard is the operational front page. It shows the current run-state title and exposes the three commands that matter most in practice: Refresh Status, Run and Stop.
Busy states: The UI keeps the command buttons disabled while a request is in flight.
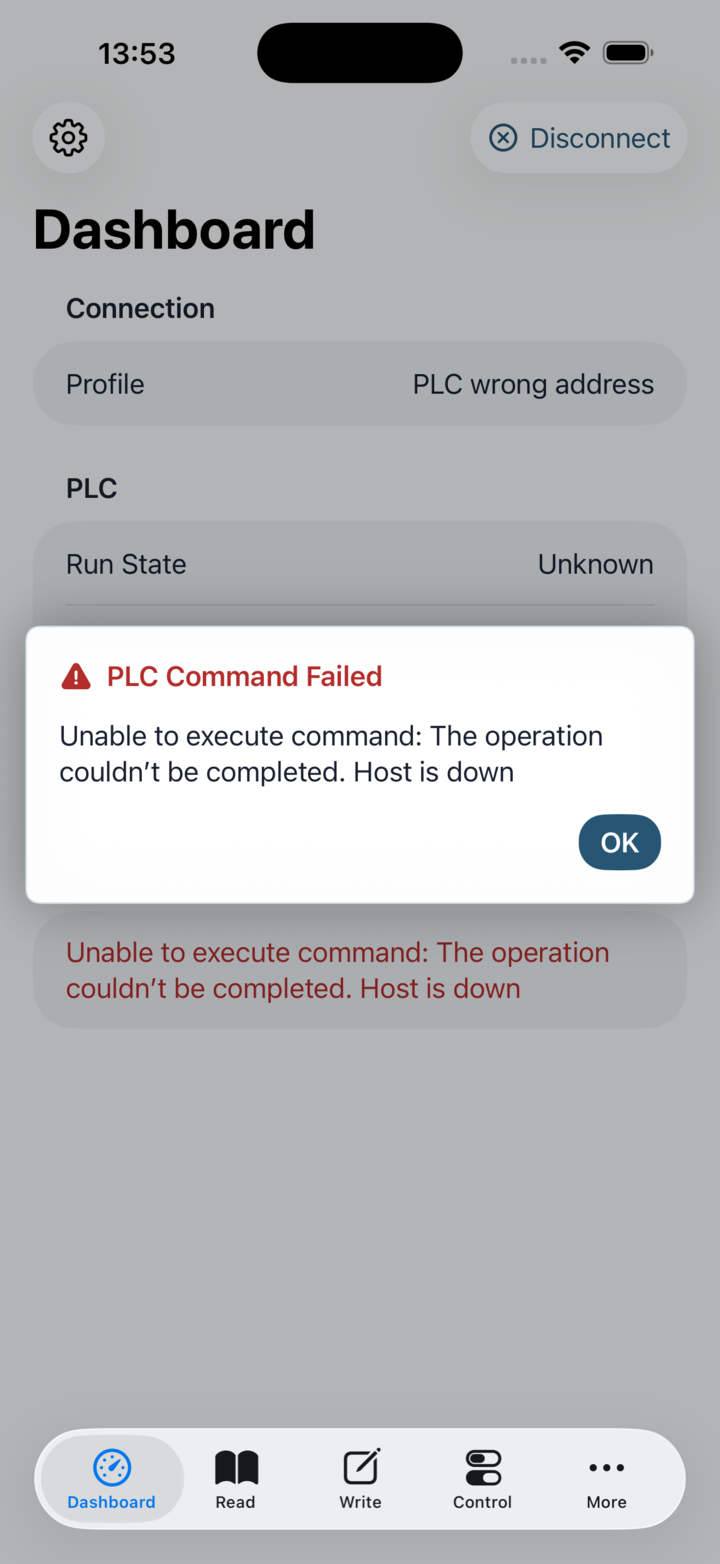
Fresh state: The Run State is Unknown until a status response is received. Dashboard reads status on first appearance and refreshes it again after a successful Run or Stop command.
Refresh loop: Refreshing after Run or Stop is intentional because the status snapshot is what updates the displayed state.
Immediate control: Run and Stop send their PLC commands immediately. Confirm the active profile and connected equipment before tapping; the screen does not ask for a second confirmation.